Today’s Solana price analysis suggests a bullish trend as the asset’s value has increased after getting support due to persistent efforts by the bulls. Following a recent decline amidst a bearish trend, the bulls have successfully taken control after a correction observed yesterday, resulting in a price increase to $21.9. This trend is expected to continue, with further price increases anticipated in the upcoming hours.
SOL/USD 1-day price chart: Is a bullish revival possible?
According to one-day Solana price analysis, the value of SOL/USD has demonstrated an upward trend for today, despite a previously bearish market. Market conditions have shifted in favor of buyers, leading to a notable increase in the asset’s value over the last few hours. At present, the coin is trading at $21.9. While the gains are relatively modest compared to previous losses, it is anticipated that the upward trend will continue, leading to further gains in the near future.

Despite the recent bearish trend, the SMA 20 curve is close to crossing over the SMA 50 curve. The moving average (MA) is stable at $22.42, which is just above the current price level. The upper Bollinger band value has been adjusted to $34.8 due to a decrease in volatility, indicating strong resistance. Similarly, the lower Bollinger band value has been adjusted to $20.2, serving as a robust support level. Additionally, the Relative Strength Index (RSI) score has risen to 47, implying an increase in buying activity in the market, as shown by the upward trend of the indicator.
Solana price analysis: Recent developments and further technical indications
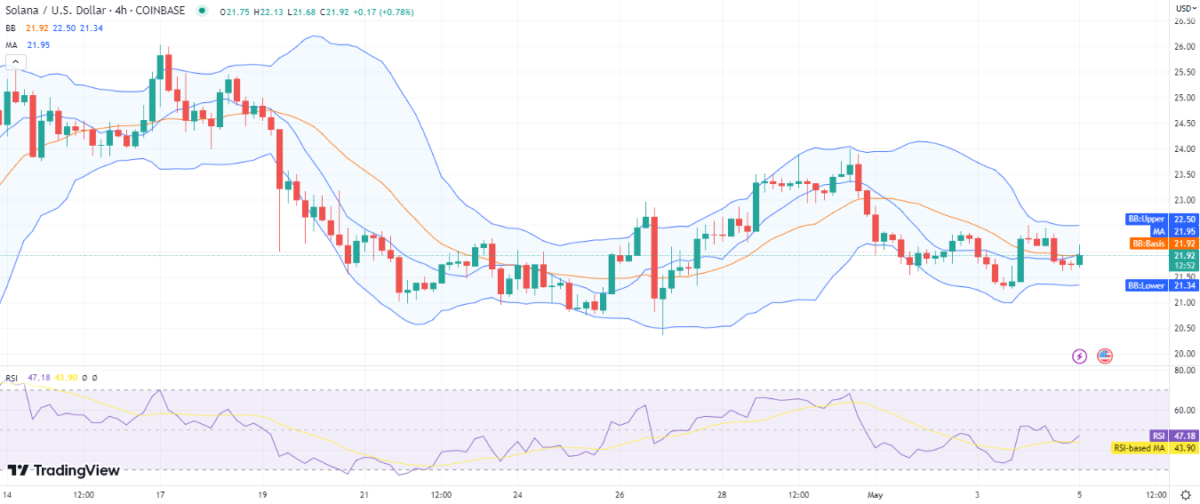
Over the last four hours, the hourly Solana price analysis has indicated a substantial rise in SOL/USD price. The upward price breakout has resulted in a steady increase that has persisted throughout the trading session. Despite this positive development, there remains a risk of selling pressure resurfacing, as the price has experienced a decline following a sharp rise to the $21.9 level.

The current price analysis for Solana indicates a positive trend, as the moving average on the 4-hour chart is trending upwards at a level of $21.95. The Bollinger band average is positioned at $21.92, with the upper band at $22.5 and the lower band at $21.34. In addition, the Relative Strength Index (RSI) has shown an upward trend with the curve trending at index 42, indicating buying activity in the market.
Solana price analysis: Conclusion
Based on the Solana price analysis provided for both hourly and daily charts, it is apparent that bulls have taken control of the market today, leading to an uptrend in the SOL/USD trading pair. The price has experienced a significant surge over the last four hours, indicative of strong buying activity. The hourly chart is also indicating positive signals, suggesting that the price may continue to rise. Investors should remain vigilant of any sudden selling pressure that may emerge, though this possibility is currently not supported by the existing market trends.


