Uniswap price analysis shows the bears have been able to suppress the price levels below the $5.96 level during the latest downtrend. The bears are reigning over the price charts as the price has decreased again during the day. Currently, it is settled at the $5.96 mark and is expected to decrease to an even lower level in the coming hours as well. The broader cryptocurrency market is showing signs of decline, and the downward momentum is expected to continue. Nonetheless, by resisting the negative push and assisting the token in gaining stability, the bulls might still offer some support near $5.92. The $6.41 level, which was just broken, serves as resistance for the UNI/USD pair right now. However, the bears have taken control, and the price is unlikely to cross this level in the near future.
UNI/USD 4-hour price chart: Bears maintain their bearish outlook as the price falls below $5.96
Looking at the 4-hour Uniswap price analysis shows signs of bearish activity taking place as the price has decreased to a considerable level. The price is standing at the $5.96 mark at present and is expected to move even lower in the upcoming time period. The Bollinger bands are currently close to each other, which is a sign of low market volatility. Therefore, we can expect the market to remain bearish over the next few hours, as it could target the $5.90 mark. The upper and lower Bollinger bands, which signify resistance and support for UNI, are at $6.590 and $5.851, respectively.
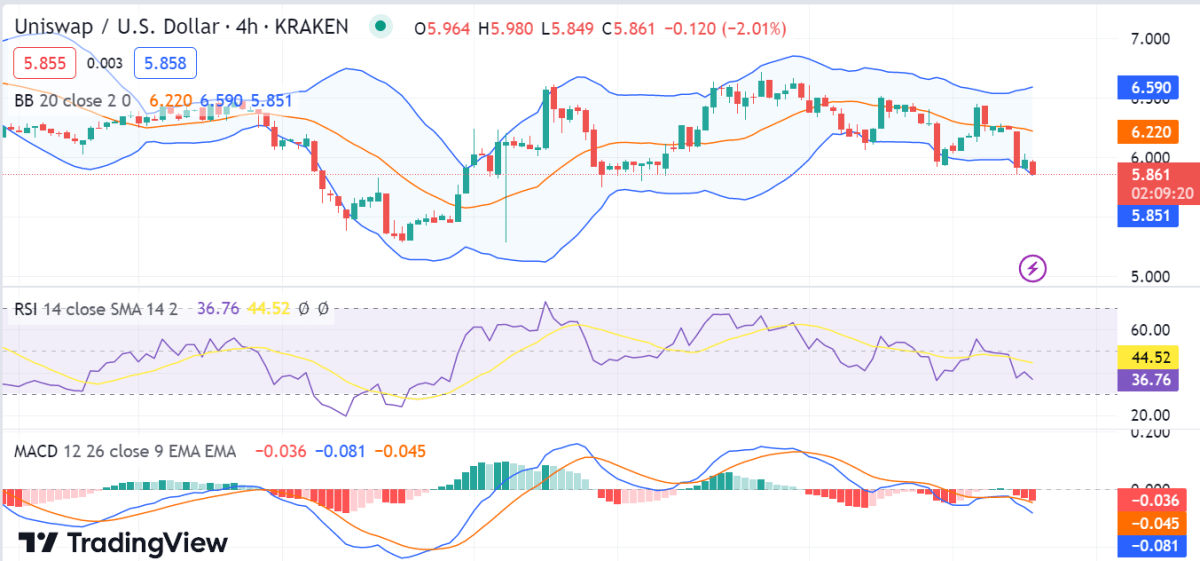
The relative strength index (RSI) value is currently at 36.76, which shows that the current momentum is quite weak and the selling pressure is dominant. Moreover, the moving average convergence and divergence (MACD) line is below the signal line, which shows that the downward trend of UNI/USD is going to continue in the near future.
Uniswap price analysis 1-day chart: Bearish momentum continues
The 1-day Uniswa price analysis coin is displaying bearish indicators as the price has dropped to the $5.96 level. The price has decreased significantly as the bearish momentum has intensified for the last few days and is expected to move even lower in the upcoming time period. In the 24-hour price chart, the technical indicators are showing a bearish sign, with the MACD line standing below the signal line, indicating a bearish momentum.
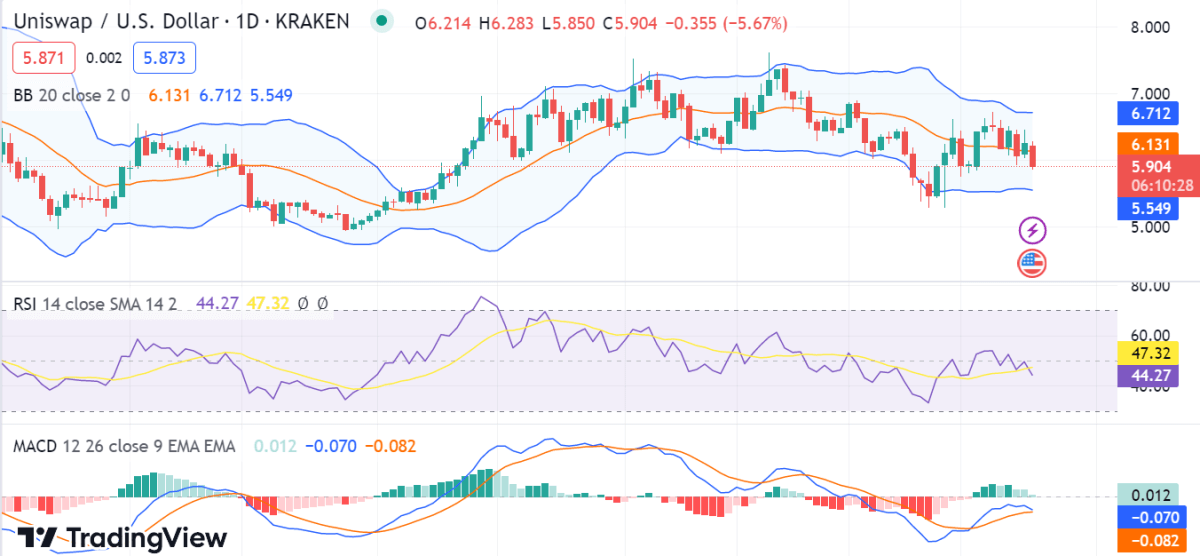
The Bollinger band’s upper band, or $6.712, represents the UNI price’s greatest resistance. Bollinger’s band’s bottom boundary, which represents UNI’s strongest support, is at $5.549. The Relative Strength Index (RSI) also confirms the bearish market sentiment, as it stands at 44.27, way below the oversold level and signaling that there is more bearish pressure to come.
Uniswap price analysis conclusion
In conclusion, Uniswap’s price analysis confirms that the price has experienced bearish progression today, as confirmed by the one-day and four-hour charts. The bears are on track, having brought the price down to $5.96 in the last 24 hours and remaining bearish throughout the day. It can be expected that the cryptocurrency will continue its bearish descent in the coming hours.