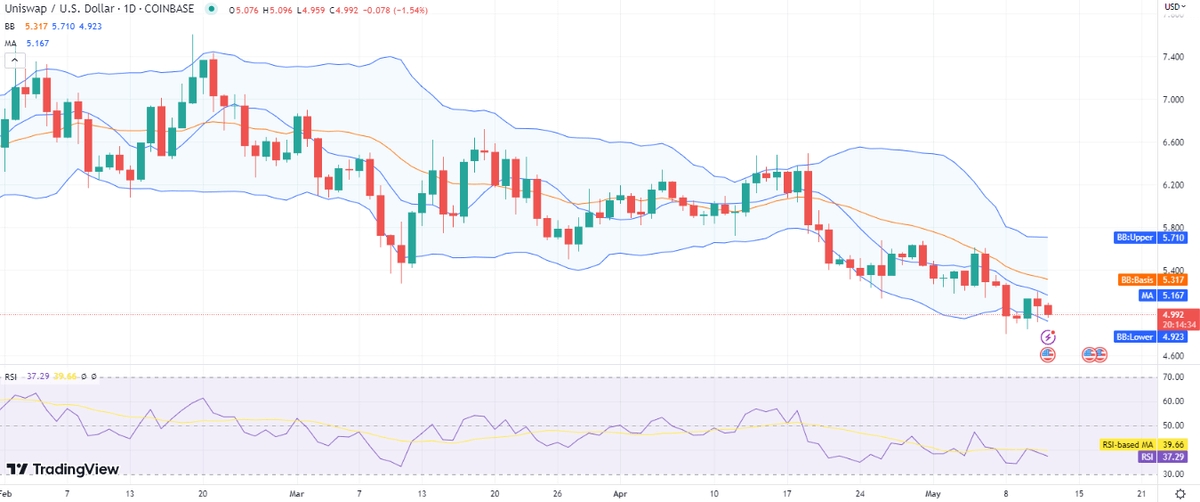
According to the Uniswap price analysis, the market’s momentum has once again turned bearish and is picking up speed. The price of cryptocurrencies has fallen precipitously to $4.99 in today’s market, severely damaging their overall value as the coin has been struggling to maintain the $5 psychological level. It is very likely that the price will shortly break through the support level. The previous month saw a significant decline in price, and this tendency has continued until the present.
UNI/USD 1-day price chart: UNI Dips to $4.99 Amid Bearish Market
As per the Uniswap price analysis for the past 24 hours, there is a rise in bearish pressure, and the bears are attempting to push the price below the current support level of $4.92. Although bullish efforts were detected towards the end of the previous trading session, they were eventually subdued by bears. Due to the bearish trend of the past few weeks, the price has experienced a substantial drop and is currently at $4.99. Additionally, the moving average (MA) stands at $5.16, surpassing the current price value.

The expansion of Bollinger bands indicates a surge in volatility, with the upper Bollinger band hitting a value of $5.71 and the lower Bollinger band touching the support level of $4.92. The Relative Strength Index (RSI) has further verified the downward trend, as it currently stands at 37, indicating a selling activity in the market.
Uniswap price analysis: Recent developments and further technical indications
The 4-hour Uniswap pric analysis reveals that today’s market has seen a decline in the price, indicating the return of the bears, with the price settling at $4.99. The price is anticipated to drop further from this point. A significant bearish signal is evident from the downward trend of the short-term trend line. The moving average stands at $5.09, surpassing the current price level. Meanwhile, the Bollinger bands average is trending at $5.033.

On the 4-hour chart, the volatility is decreasing, leading to the upper Bollinger band settling at a value of $5.16, and the lower Bollinger band touching the $4.90 level. The Relative Strength Index (RSI) has rapidly declined and is currently at 39, suggesting a robust selling pressure in the market.
Uniswap price analysis
Both the one-day and 4-hour Uniswap price analysis indicate that the bears are currently dominating the market, with the Uniswap price experiencing a decline and settling at a value of $4.99 at the time of writing. It is worth noting that the current bearish trend may be viewed as an indication of a potential market downturn by some, with the price likely to breach the support level of $4.92 soon. However, market conditions are highly unpredictable and could change quickly, making it difficult to forecast future price movements with certainty.


