
Uniswap’s price analysis indicates a bullish market sentiment after the cryptocurrency broke above the $5.97 level. The UNI/USD pair has found support at $5.70 and is currently trading at $5.97. The price of the Uniswap token has been in a steady uptrend since the beginning of today. The bulls have been pushing the price higher, and the bears have been unable to break below the $5.70 level. The resistance for the UNI/USD pair is at $6.03, and a break above this level could see the Uniswap price reach $6.00. Uniswap has seen a slight price increase of 4.26% in the past 24 hours. The market cap for the coin is $2.801 billion, and the 24-hour trading volume is $69 million.
Uniswap price analysis 1-day chart
The 1-day Uniswap price analysis indicates that the market sentiment is bullish and the price could break above $6.03 in the near future. The price has been in a strong uptrend since the beginning of today, and it is expected to continue its trend higher. The technical indicators also support the bullish sentiment and indicate a further rise in the Uniswap price.
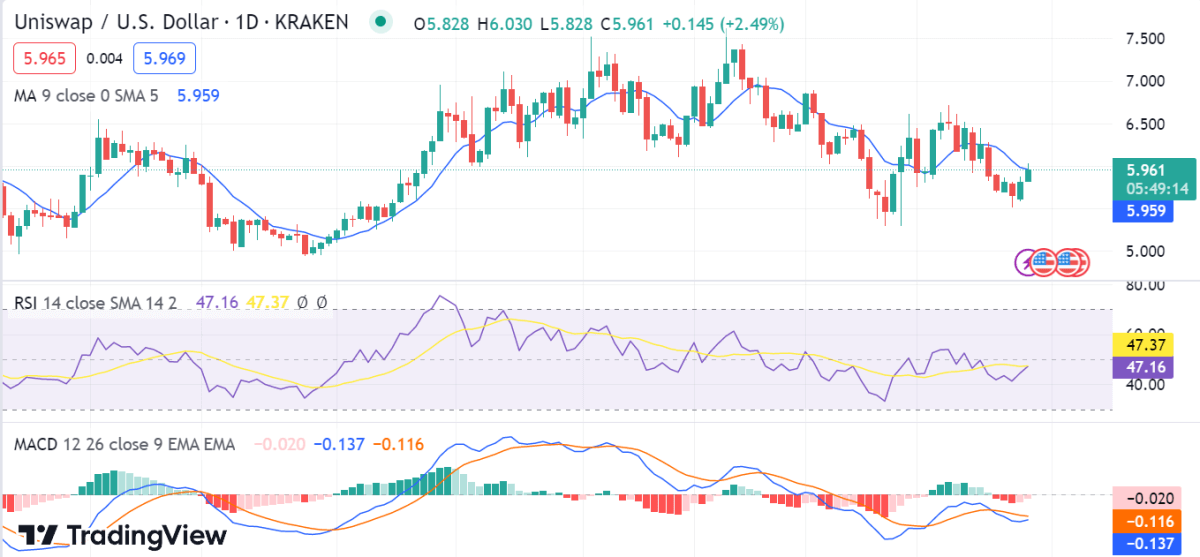
The MACD indicator on the 24-hour price chart shows the Uniswap price is currently in a bullish state. The MACD line has crossed above the signal line, indicating an increase in buying pressure. The 50-day and 200-day moving averages have maintained their bullish crossover, indicating a further potential for gains in the near term. The relative strength index (RSI) also shows the Uniswap price is currently in a bullish state.
UNI/USD 4-hour price chart: Recent updates
Looking at the hourly Uniswap price chart shows that the bulls have managed to push the price above $5.97 as it rebounds after the relative price dip. This indicates that the buyers are still in control and could push the price higher in the near term. The nearest support level is at $5.70, while the nearest resistance is at $6.03.
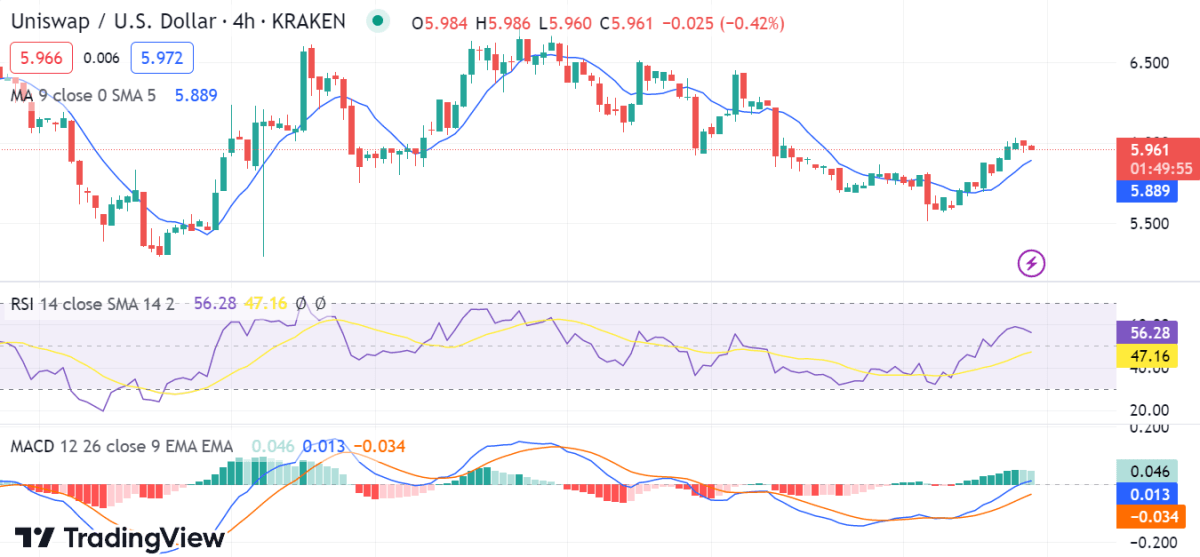
The Relative Strength Index (RSI) is indicating a bullish sentiment with an above-average reading of 56.28. The Moving Average Convergence Divergence (MACD) is also in bullish territory with a positive divergence. Moreover, the 50 MA is currently at $5.889 and is acting as support for the market, while the 200 MA at $5.961 is serving as resistance.
Uniswap price analysis conclusion
In conclusion, Uniswap’s price analysis shows that there has been a rise in the near term, and it is expected to break past the resistance level of $6.03 in the coming days. Additionally, the bullish sentiment is supported by the technical indicators, which indicate further gains in the near term. Therefore, traders should keep an eye on the price movements and make wise decisions with their investments.


