Waves price analysis shows a slight downward trend in current market conditions. The crypto is trading at $3.23, and it has decreased by 7.59% in the last 24 hours at the time of writing. Prices have been trading between $3.53 and $3.22 over the past 24 hours. The next few hours may see upward price movement as the bears take a breather, but any rallies are likely to be short-lived as the overall trend remains bearish.
The WAVES/USD pair is bearish today as the price reaches a low of $3.22 after failing to sustain above the $3.53 resistance level. The most recent attempt at a corrective rally occurred yesterday, but this was too sold into, leading to the current decline.
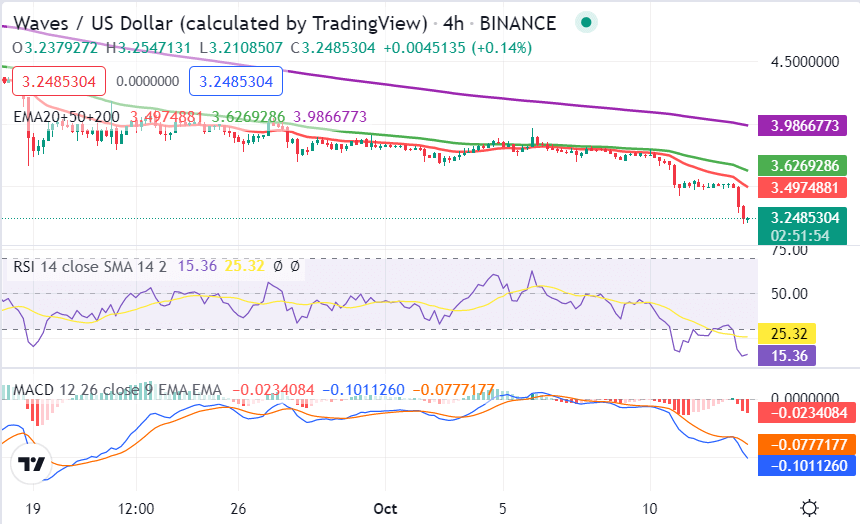
Waves price action on a 1-day price chart: Bears are adamant as they push prices below $3.23
On 1-day timeframes, the Waves price analysis is bearish today as prices slip below $3.23. The bears have been in control of the market for the last 24 hours and are likely to push prices lower in the next few hours. The 24-hour market cap for the Waves price analysis is currently at $354,898,494, and the trading volume is at $74,733,985. The bulls may take control of the market if prices manage to sustain above the $3.53 resistance level. A breakout above this level could lead to a move higher toward the $4.00 resistance level. However, any rallies are likely to be short-lived as the overall trend remains bearish.

The EMA50 and EMA200 are both close to crossing over on the 1-day chart, which is a bearish signal. The Relative Strength Index (RSI) is currently at 25.32 and is slowly rising, which indicates that the bears are losing momentum. The Moving Average Convergence Divergence (MACD) histogram is also bearish as it continues to decline.
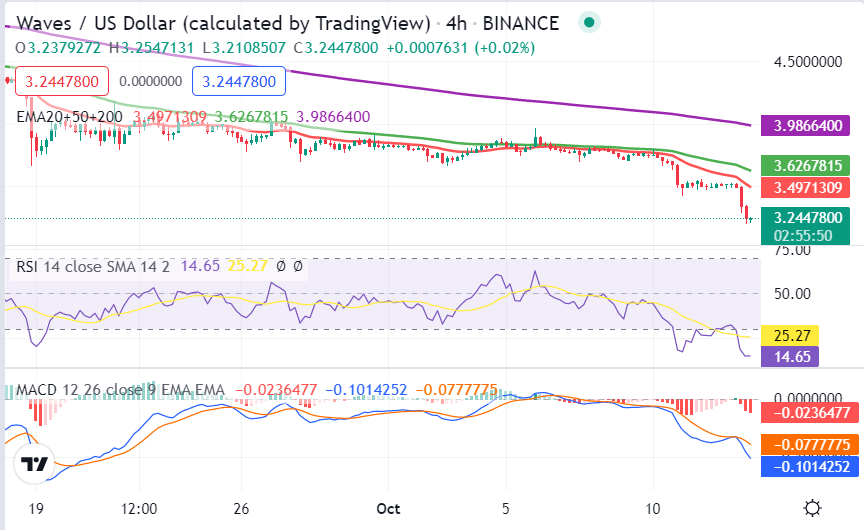
Waves price action on a 4-hour price chart: Resistance at $3.53 is currently limiting upward momentum
The 4-hour timeframe for the Waves price analysis shows that the bears have been in control of the market for the last 4- hours. The price is currently trading below the $3.53 resistance level and looks likely to continue falling.

The WAVES/USD price appears to be crossing under the curve of the Moving Average Convergence Divergence (MACD) histogram, which is a bearish signal. The 50 EMA is below the 200 EMA, indicating that there is a long-term trend in bearish trend. The Relative Strength Index (RSI) is currently at 25.27 and is moving below the 50 level, which indicates that the market is bearish.
Waves price analysis conclusion
Waves price analysis for today shows the prices are trading in a bearish trend as the market is under pressure. Prices have found some support at $3.22; however, the market remains under pressure. The market is facing some selling pressure in recent hours, with no signs of bullish momentum.
Disclaimer. The information provided is not trading advice. Cryptopolitan.com holds no liability for any investments made based on the information provided on this page. We strongly recommend independent research and/or consultation with a qualified professional before making any investment decisions.


