
The weekly crypto price analysis reveals that most of the coins have been trading in a neutral trend with bulls and bears being equally active in the market. For the whole of the week, the top coins have remained rangebound between their upper and lower boundaries. Bitcoin has been trading between its $26,787 and $28,755 range with occasional price surges. Ethereum (ETH) has also been trading in a tight range between its 1,723 and 1,839 levels.

Ripple (XRP) managed to remain a bit more volatile as it has been steadily climbing above the $0.40 mark for the past few days. Binance Coin (BNB) has been trading in its $318 to $324 range since the previous week. Cardano (ADA) has been trading in a range of between $0.3328 and $0.3868 while Solana (SOL) had a strong week as it broke out of its previous range and stayed above the $20.00 mark for most of the time.
On March 24th, jitters over the potential resurgence of a banking crisis sent European markets into an unsettling downturn. This was sparked when Deutsche Bank’s credit default swaps inexplicably became volatile on the 23rd – plummeting its shares by 11% with no discernible cause. The specter of instability cast a pall upon investors and their decision-making processes that day, hastening market decline across Europe.
Christine Lagarde, President of the European Central Bank, was able to ease global markets with her statement that euro banking institutions were well guarded due to implemented reforms post-global financial crisis. This could contribute in partto the strong recovery experienced by United States equities indexes from their intraday lows. Although the banking crisis has been positive for Bitcoin’s price, crypto prices are still trading in rangebound areas.
BTC/USD
On March 23, Bitcoin formed an inside-day candlestick pattern indicating that buyers and sellers were in a state of uncertainty. Bitcoin price has been trading in a range between $26,787 and $28,755, with buyers and sellers both being active. BTC/USD is currently trading at $27,556 with a loss of 1.05 percent in the last 24 hours.

The technical indicators for BTC/USD suggest that there is more room for the cryptocurrency to go higher in the short term. The RSI has been trading near the 63.53 level and MACD made a bearish crossover today after staying in bullish territory for some time.
ETH/USD
Ethereum has successfully broken the 1,700 level for the past few days and is currently trading at $1,739 with a loss of 0.97 percent in the last 24 hours. ETH/USD has been consolidating within its range since the start of the week and is likely to surge further if it can break above the 1,900 level.

The market capitalization of Ethereum is currently around $213 billion and a 24-hour trading volume of $8.84 billion. The technical indicators for ETH/USD suggest that the sellers are in control and the market today after some brief bullish momentum. The RSI and MACD are bearish while the stochastic oscillator is neutral.
XRP/USD
Ripple managed to remain a bit more volatile as it gained against the US Dollar and broke the $0.40 mark for the past few days. XRP/USD is currently trading at $0.444 with a gain of 3.78 percent in the last 24 hours and an increase of nearly 8 percent in the last week.

The technical indicators for XRP/USD are mixed, as the MACD is bearish while the RSI and stochastic oscillator are bullish. A break above the $0.45 level could trigger more buying and XRP/USD could continue its upward momentum towards the $0.50 mark in the near future and if bears gain the upper hand then it could fall towards the $0.40 mark again.
Binance Coin (BNB)/USD
According to our weekly crypto price analysis, Binance Coin has been trading in the neutral range with bullish and bearish corrections taking place at the same time. Today’s BNB/USD pair is trading at $317.73 with a minor gain of 0.02 percent in the past 24 hours. The coin has also lost more than 5.73 percent in the past seven days.
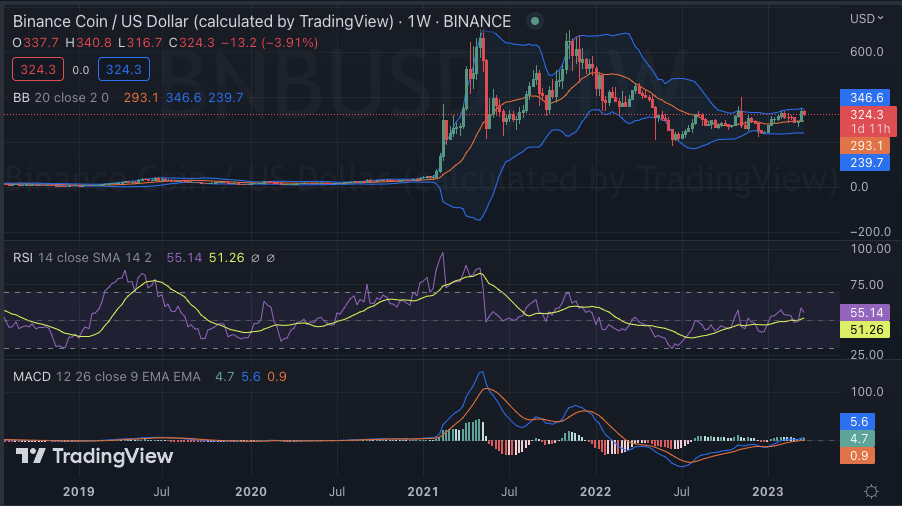
Looking at the technical indicators, we can see that the MACD (Moving Average Convergence Divergence) has crossed its zero line indicating a bullish trend while the RSI (Relative Strength Index) is currently trading close to 55.14 levels. On the upside, buyers will be looking to break through the resistance level of $324.18 while on the downside, they will aim to defend the support around $317.78. If the bulls manage to break through this resistance and sustain their momentum, we could see BNB/USD testing its all-time high at $389.39.
ADA/USD
Our weekly crypto price analysis reveals Cardano has been in a tight range for the past few days as it oscillates between $0.3328 – $0.3868 with no clear direction in sight yet. Today’s ADA/USD pair is currently trading at $0.3587 with minor losses of 1.17 percent in the last 24 hours and an overall gain of 0.66 percent in the past week.

The technical indicators for ADA/USD are bearish as the MACD is currently in a bearish crossover and the RSI is trading close to 45.45 levels. From the support point of view, buyers will be looking to defend the $0.357 level while on the upside, they need to break past the resistance at $0.3643 for further upside momentum. If the bulls manage to do so, we could see ADA/USD trading back in the $0.36 – $0.38 range within a few days. The 50-day moving average is still indicating a bearish trend so traders should stay cautious and aware of any further downside risk.
SOL/USD
Solana has been quite volatile for the past few days as it trades between $20.44 – $23.58 and today’s SOL/USD pair is trading at $20.68 with a loss of 0.91 percent in the last 24 hours and a total decrease of 7.53 percent in the past week.
On the upside, buyers will be looking to break past $21.69 for further bullish momentum while on the downside, they will aim to defend the $20.36 level as a major support. If the bulls manage to break through the resistance and sustain their momentum, we could see SOL/USD testing its all-time high of $24.64 shortly.

The technical indicators for SOL/USD have been in the mixed territory with the MACD being bearish while the RSI is neutral. The 50-day moving average is still indicating a bearish trend so traders should remain cautious of any further downside risk in the near term.
Weekly crypto price analysis conclusion
Overall, the market has been quite mixed this week with some coins showing gains while others incurring losses. It is important to keep a close eye on the key levels and technical indicators of each coin before investing or trading. Buyers should look for bullish breakouts while bears should wait for bearish trends to emerge for them to capitalize on the market. With that in mind, we expect to see some volatility and possible price movements shortly as we approach the end of the week.


