
Chainlink price analysis confirms a bullish trend for today, as LINK moved above the $7.52 mark at the time of writing. The momentum appears to be strong as more buyers enter the market; however, resistance is present at the $7.70 mark and should be monitored for any further bullish momentum.
The digital asset has been on a bull run since the beginning of today, and it looks like the uptrend is set to continue in the near future. LINK has outperformed most of its competitors in the market, and it is currently one of the best-performing cryptocurrencies. The market capitalization of LINK has seen an increase of around 3.38% in the last 24 hours, while the trading volume is currently at $502 million.
Chainlink price analysis for 1 day: LINK follows an uptrend as price trails past $7.52
The one-day Chainlink price analysis confirms the bullish lead for today as the coin value has recovered considerably. The coin value suffered during the past day as the selling pressure was trying to take over, however, the buyers were able to push back and keep the coin afloat above $7.50. The LINK/USD has gained more than 3.38% in the last 24 hours and is currently trading at $7.52.

The volatility in the one-day price chart is high, the upper Bollinger band is present at the $7.53 mark while the lower Bollinger band is found at the $6.11 mark. The 20-day moving average is also positive, indicating that the bullish momentum will continue in the short term. The moving average indicator has crossed above the candles, creating a bullish crossover which is an indication of further upward movement. The RSI indicator is at the 58.81 mark, which is an indication of a slight bullish bias in the market.
LINK/USD 4-hour price analysis: Price returns to $7.52, increasing chances for recovery
The hourly Chainlink price analysis favors the buying side as well, as a strong rise in LINK/USD value has been detected in the past few hours. The bulls have taken over the market and have uplifted the price level to $7.52, which was a level of resistance earlier. The LINK has been trading in a range- between $7.19 and $7.70- in the past 4 hours, and the buyers were able to breach through the upper range easily.
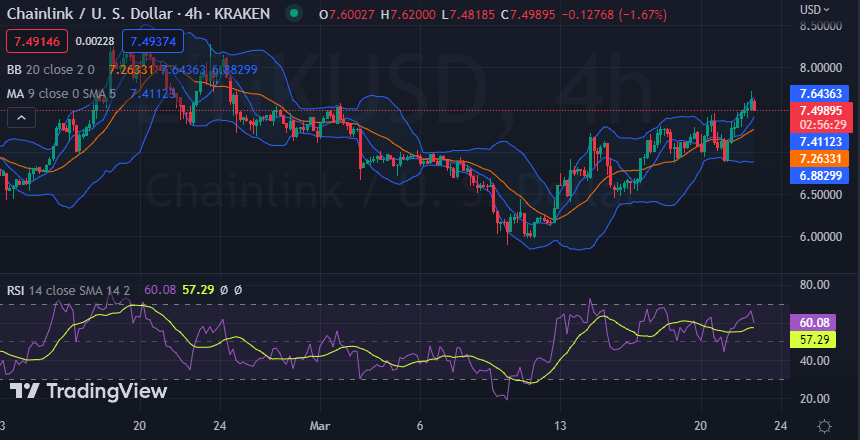
The 4-hour chart shows that the relative strength index (RSI) is currently at the 60.08 mark, which is an indication of a neutral market. The moving average indicator is also positive at $7.41, which is a sign of further bullish sentiment in the market. The Bollinger bands are also expanding, and the upper band is at the $7.64 mark, while the lower band is at the $6.88 mark.
Chainlink price analysis conclusion
Overall, Chainlink price analysis shows a bullish trend in the cryptocurrency market as LINK/USD moves past $7.52. The bulls have taken over the market, and LINK is expected to gain further bullish momentum in the near future. The technical indicators also point towards a positive trend, which indicates that there is room for growth in the short term. Traders are advised to keep an eye on the resistance levels at $7.70 and $8.00 for any potential breakouts. For now, the long-term trend appears to be positive, and LINK/USD should continue to outperform its peers.


