
The latest Ethereum price analysis shows an uptrend in the ETH market driven by a rise in demand. The ETH/USD is currently trading in bullish territory, which is a reflection of increased investor confidence in the coin. The recent price surge in Ethereum has been accompanied by an increase in trading volume, indicating that investors are actively buying into the coin.
The ETH/USD is currently trading at $1,796 and has reached a high of $1,835 over the past 24 hours. This marks an increase of 5.10% from its daily low of $1,717. The next resistance level is at $1,853, and if Ethereum breaks this, it could climb up to the $1,900 mark in the near future.
The market capitalization of Ethereum is currently around $221 billion, making it the second largest cryptocurrency in the world behind Bitcoin, while the trading volume has reached $11.8 billion, which is the highest in recent weeks.
Ethereum price analysis 1-day chart: cryptocurrency is trading in an uptrend
Looking at a 24-hour price chart, the Ethereum price analysis shows chances are increasing for the buyers to secure their permanent lead as the price has been floating above $1,800 and has reached $1,810. In the past few hours, a smaller level of recovery has been reported as the price has increased nominally. The gains have been small, and the chances of an upcoming upswing can be availed if bulls show momentum, which they lack at the moment. The price has been trading lower than the moving average (MA) level as well, which is settling at $1752 for now.
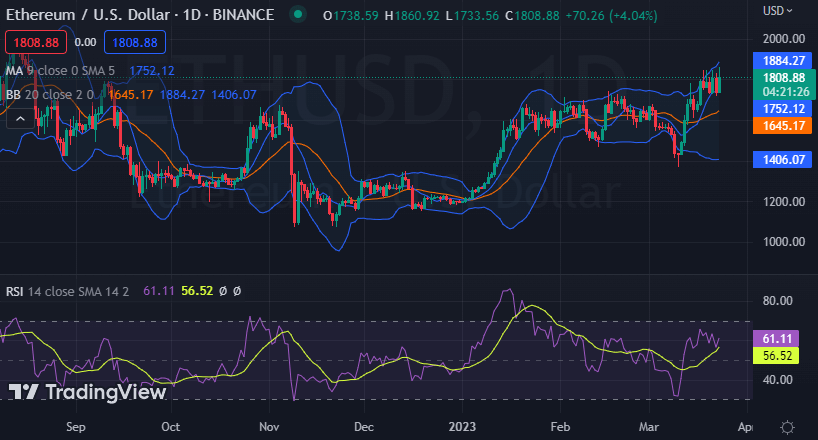
The volatility is increasing as the price underwent a significant fall in the past week. The Bollinger band indicator in the 1-day chart dictates the following values; the upper value is $1884, and the lower value is $1406, which shows that ETH/USD is facing rejection at the upper level. The Relative Strength Index (RSI) value is seen at 61.11, which shows that the market is still indecisive and needs buyers to take control of the trend.
Ethereum price analysis: Next resistance level at $1,853 which could push prices up to the $1,900 mark.
The 4-hour Ethereum price analysis shows that the bulls are still active, and if the buyers can take control, then a further upswing is expected in the near term. The price has been trading above $1,800 for some time, which is acting as a significant support level. The market for ETH opened trading at around $1,736 and has since risen to its current position of $1,810.

The volatility has been increasing on an hourly basis as the Bollinger bands are expanding, and now the upper Bollinger band is at $1,840, which may act as a resistance level, while the lower band is at $1,709, which may act as support. The RSI is seen at 55.68, which shows that the market still has room for gains if buyers can take control. The moving average indicator is at $1774, which shows that the market could experience a bearish breakout in the near future.
Ethereum price analysis conclusion
The overall Ethereum price analysis shows that ETH is trading in an uptrend, with prices currently above the $1,800 mark. The sellers are trying to take control of the trend, but the buyers are still actively trading and pushing prices higher. The next resistance level is at $1,853, and if Ethereum breaks this, it could climb up to the $1,900 mark shortly.


